Time Series
Unit... 1.1
Time series
There is nothing constant in the universe
All ebb and flow, and every shape that’s born
Bears in its womb the seeds of change.
-Ovid
The world is dynamic. There is nothing stable or constant in world. Changes are taking place at every moment of time. It is rightly said that the importance of time is great. Changes are taken place continuously in statistical time series also. It is necessary to study the changes and to classify these changes and to compare with similar changes in the other series. If we are able to identify the reasons behind these changes, we may predict the future changes by knowing the direction of past changes. Really, is it not the significant advantage? So, in modern world especially in economic and business world the analysis of time series becomes important day by day.
1.1 Meaning of time series
Forecasting is often necessary in the
field of economics, commerce and management. We know that many variables vary
with time. For example if we look at the figures of population, agricultural
production, industrial production, exports, sales, employment, prices,
electricity consumption etc. we find that the figures change with time.
A set of figures relating to a variable arranged according
to time is called a time series.
Consider the following series of production (in thousands of
tones) of a company.
|
Year |
1964 |
1965 |
1966 |
1967 |
1968 |
1969 |
1970 |
1971 |
|
Production |
35 |
39 |
44 |
33 |
45 |
54 |
57 |
56 |
This is a time series. It is used for forecasting. It is
also called as historical series since it describes the history of the
variable. Some other definitions of time series are:
According to Morris Hamburg, Time series is a series of statistical observations arranged in a
chronological order. The observations in the chronological order indicate the
order of occurrence, taken at regular successive intervals of time. The time
intervals may be years, months, days, minutes and in some cases seconds also.
Mathematically time series is defined by the values Y1, Y2
, ----- , Yn, ----of the variable
Y at times t1, t2 , ----- , tn,
----. The time points t1,
t2 , ----- ,
tn, --- are equidistant. This definition is due to Spigel.
Here time series is a function of time i.e. Y = F(t). Thus, in time series time
is an independent variable and Y(t) is dependent variable. We denote time
series by Y(t) or Yt. In the form of function the time series is
represented as follows:
|
t |
t1 |
t2 |
t3 |
---- |
tn |
|
Yt |
Y1 |
Y2 |
Y3 |
---- |
Yn |
The examples of time series are:
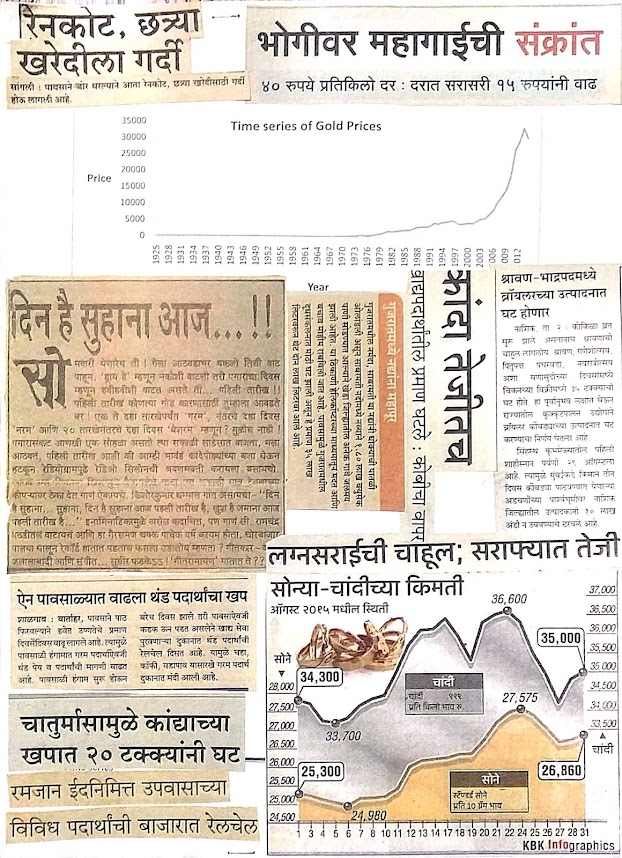
1. Daily price of
gold
2. Weekly sales of
departmental store
3. Monthly deposits
in a certain bank
4. Yearly production
of food grains of a country
5. Daily record of maximum or minimum temperature of a city
6. Population of a country at census years.
If we carefully observe the figures in the above given
example of time series of production, we see that the production is increasing,
although for some years it has decreased. The graph of this time series
is:

Figure 1.1
The graph of
time series is called as Historigram and its nature is usually zig-zag or
haphazard. It is obtained by plotting the data on a graph paper taking the independent
variable time (t) along X - axis and dependent variable y along Y -axis.
1.2 Components of time series
The factors responsible for the changes
in the time series are called as components of time series. There are four
components of time series.
1. The secular trend or trend: An overall tendency of the series to rise or
to fall.
2. Seasonal variations: A regular up and
down due to seasons.
3. Cyclical variations: Changes due to
booms and depressions.
4. Irregular variations: Changes due to
unpredictable causes.

1.3 Utility (Importance) of analysis of time series:
The analysis of time series is of great
importance to economists and businessmen, because it helps them to understand
past, to control the present (comparison) and to plan for the future
(forecasting).
1. It helps to
understand past
By analysis of time series, we can understand the past
behavior of the variable. It is assumed that it will behave in future in the
same manner as it did in the past.
2. It helps to
plan for the future
By analysis of time series, we are able to predict the
future requirements and to plan our activities accordingly.
3. It helps to control present performance
By analysis of time series, we compare the actual performance with estimated performance and take the necessary steps. We also compare the two related time series by analysis of time series. For example; prices of gold and prices of shares.
1.4 Trend or Secular trend
The term secular trend or simply trend refers to the general tendency of
the variable to increase or decrease. For ex; the population, agricultural
production, prices, literacy etc. are increasing while death rate, illiteracy,
travel by bullock cart, yearly birth rates, cost of electronic goods
decreasing. The rise or fall may be steep or gradual. When we say that there is
an increasing trend, it does not mean that the variable is always increasing.
There may be some places where the variable decreases.
There are many factors which cause secular trend, the most
important of which is the rise in population. The rise in prices, in
population, in sales, in travel etc. is primarily due to the rise in
population. Besides these there are other factors which cause secular trend.
They are progress in science, improvements in technology, changes in culture,
habits and tastes of people.
Remarks:
1. The word secular is defined from Latin word saeculum which
means generation or age.
2. Trend is a long period movement. Period can not be
precisely defined ex. gold prices.
3. Trend is mostly monotonic, although original series is not.
4. Apart from the long term growth component, there are some
short term periodic rhythmic
variations. These variations disturb the smoothness and monotony.
5. Trend is useful for two reasons: i) For comparison of two
series
ii)
It helps to extrapolate.

1.5 Seasonal variations
This
kind of variation is basically due to the seasons of the year. But it also
includes the variations of any kind which are periodic in nature and whose
period is less than a year. The ups and downs due to bazaar days or on weeks of
month or on months of a year are seasonal variations. The factors causing seasonal
variations are:
1. Seasons of a year
The most important factor
which causes seasonal variations is
the seasons of a year. There will be
an increased demand for umbrellas, raincoats etc. in rainy season; for hats, sunglasses,
cold drinks etc. in summer and for warm clothing in winter.
2. Festivals and Customs
The factors such as
festivals, customs or traditions cause seasonal variations. For ex the demand
for clothe, sweet, crackers etc. increases during festivals like Diwali, Id,
Christmas. Also there is greater demand for gold, costly cloth, presentation
articles etc. during marriage seasons.
3. Practical needs
There are certain
practical needs which cause variation in the time series. There are large
withdrawals on the 1st of every month for payment of salaries. The
demand of electricity is very high during certain hours of the day. There is
heavy rush for local transport during certain hours of the day.
The third
component in time series is the cycle which is different from trend or seasonal
variations. Cyclic variations are very common in economic and business
activities. They show oscillating movements upward and downward forming a wave
i.e. a cycle. There are four phases of a business cycle
i)
Prosperity ii) Decline ( Recession) ii) Depression iv) Improvement ( Recovery)
The
interval of time from one prosperity to next is called the period of cycle and
it is anywhere between 3 to 10 years. Business cycle is the main cause behind
the cyclic variations. Imbalances in economy, import and export facilities
& policies, availability of loans, inflation, over development, decreasing
efficiency of personnel (automation) and business competitions are some reasons
for the business cycle.
Difference between seasonal variations and cyclic variations:
i) Reason: Seasonal variations are due to seasons,
festivals, customs and needs of people while cyclic variations are due to business
cycle.
ii) Period: Seasonal variations are up and down
swings of period less than a year. Cyclic variations are of period 3 to 10
years (or higher).
iii) Intensity: The intensity of seasonal variations is
less than the cyclic variations.
 |
|||
1.7 Irregular variations
These variations are also
called as random variations. They include all those variations which are not
covered by the above three components and which are caused by factors other
than those discussed earlier.
The causes of irregular variations
are accidental like wars, earthquakes, floods, famines, fires, strikes etc.
These factors are unpredictable, irregular variations are uncontrollable.
1.8 Analysis of time series
The study of
time series i.e. the study of change in the figures of time series is called as
analysis of time series. It’s purpose is two fold.
i) Identifying
the four components which cause variations
ii) Isolating,
studying and measuring each of them independently.
1.9
Mathematical Models of Time Series:
In analysis, it
is required to know how the components interact and give the joint effect. This can be done with the help of models. There
are two models commonly used for the decomposition of time series in to its
components.
i) Additive
Model
Under additive model, the time series
can be expressed as,
Yt
= Tt + St + Ct + It
where Yt is the time series value
at time t and Tt, St, Ct and It represents the
trend, seasonal, cyclical and random variations at time t. In this model St, Ct
and It are absolute values and can have positive and negative. The model
assumes that all the four components of time series are independent of each other.
In this model, the decomposition of time series is done on the assumption that
the effect of various components are additive in nature.
ii)
Multiplicative Model
Under
multiplicative model, the time series can be expressed as
Yt
= Tt × St × Ct × It
According to
this model the decomposition of time series is done on the assumption that the
effects of the four components are not necessarily independent. In this model
S, C, and I are not absolute amounts as in case of additive model. They are
relative variation and are expressed as rate or indices below or above unity.
This model assumes that these four components are mutually independent.
1.10
Measurement of Trend
The following
are the four methods which are generally used for the measurement of the trend
in a time series.
i) Inspection
(or Free hand curve fitting) method
ii) Moving
averages method
iii)
Progressive averages method
iv)Principle of
least squares method.
1.11
Moving average method
This method
consists of determining the arithmetic means for given number of years, months
or days etc. This average value is supposed to be the proper or trend value for
the middle period. By taking such averages the effects of the other variations
is reduced. The period of moving averages is taken between 3 years and 10
years. Period depends upon the cycle of data.
If
the period of moving averages is an odd number i.e. 3,5,7, -- years, the average calculated is written at
the middle year. If it is an even number ( 2,4,6,8,--years ), after calculating
the averages for that period, again the averages of each pair of adjacent
moving averages are calculated. They are called the centered moving averages.
Merits:
1. It is simple than method of least squares
2. If period of cycle is equal to period of moving averages, cyclic variations are removed.
Demerits:
1. Irregular variations are not removed. So can’t used for prediction only
for estimation.
2. Trend values can not be calculated for all the years.
1.12 Progressive average method
In the early years
of a firm, data over a long period are not available. So the method of moving
average is not used. Progressive average method is used. Progressive averages are the cumulative
averages. To calculate the progressive averages, we calculate the cumulative
sums and divide the sums by 1, 2, 3, ---- and so on. A column is also prepared
for the difference between the actual values and the corresponding progressive
averages. Thus, if
the time series values are y1, y2, y3, ------
the progressive averages are

Merit:
It is highly useful to study the trend during the
childhood of a concern.
Demerits:
Progressive averages are not useful as
the industry is grown up.
1.13
Least square method
Fitting of Linear Trend:
The idea of least
squares was developed by Gauss in 1975 and is most widely used method of
fitting a mathematical function to a given set of data.

Σ y = n a + b Σ t .... (4)
Σ t y = a Σ t + b Σ t2 .... (5), where n is the number of time series
pairs (t, y).
It is seen that equation
(4) is obtained by taking sum of both sides in equation (1) and equation (5) is
obtained on multiplying equation(1) by t and then summing both sides over the
given values of the series. Solving (4) and (5) for a and b and substituting
these values in(1), we finally get the equation of the straight line trend.
Merits:
1. It is more accurate than method of moving averages and progressive
averages least squares
2. Trend line can be used for prediction as well as estimation.
3. It is objective method free from personal bias.
Demerits:
1. It is quite tedious and time consuming , so difficult to nonmathematical person.
2. Addition of one value would require making calculations freshly, which is not so in other methods.

Multiple Choice Questions
1. The long term regular movement in a time series is called
as ………
a) seasonal variation b) cyclical variations c) secular
trend d) irregular variations
2. Time series analysis helps to ………
a) make predictions b) compare two or more series c) know
behavior of business d) all of these
3. Given that;
Statement I: Seasonal variation has period of less than one
year.
Statement II: Cyclical variation has period of more than one
year.
a) Statement I is false b) Statement II is false c) Both are
false d) Both are true
4. Periodic change in values of time series is ………
a) seasonal variation b) cyclical variations c) both a and b
d) irregular variations
5. If all four components of time series operate
independently then we use………
a) additive model b) multiplicative model c) exponential
model d) none of these
6. A time series is a set of data recorded ………
a) periodically b) at time or space interval c) both a and b
d) neither a nor b
7. Trend in a time series means ………
a) long-term regular movement b) short-term regular movement
c) at successive points of time d) all of these
8. Moving average method suffer from ………
a) the loss of information b) the element of subjectivity
c) the decision about the number of years in group d) all of
these
9. Which of the following is not a method of measuring
trend?...………
a) Moving averages b) Simple averages c) Least squares d) Progressive averages
10. The variation in the production due to strike in a
company is ....…
a) seasonal variation b) cyclical variations c) secular
trend d) irregular variations
11.
|
Year |
2005 |
2006 |
2007 |
2008 |
2009 |
|
Sale in lakhs |
4 |
7 |
10 |
13 |
16 |
|
X |
|
|
|
|
|
From the above information of the time series, X is ………
a) 4 yearly moving averages b) 2 yearly moving averages
c) 3 yearly moving averages d) none of these
12. Time series analysis helps to ………
a) understand the behavior of a variable in the past b) plan
future observation
c) predict the future behavior of a variable d) all the
above
13. To which component of time series the term recession is
attached?…
a) trend b) seasonal c) cyclical d) random variation
14. Moving average method of fitting trend in a time series
data removes the effect of …
a) long term effect b) cyclical variation c) short term
movements d) none of these
15. An additive model of time series with components T, S, C
and I is…
a) Y = T + S + C × I b) Y = T + S × C × I c) Y = T + S + C +
I d) Y = T + S × C + I
Short
answer questions
1. What is time series? State four components of time
series.
2. Describe moving average method for determining trend.
3. State different components of time series and explain any
one of them.
4. What is secular trend? Describe the method of least
squares to determine secular trend.
5. State utility of time series.
Big
answer questions
1. Explain the following terms with suitable illustration;
i) secular trend and ii) seasonal variation
2. What is secular trend? What are the methods for measuring
trend? Describe any one of them.
3. What is time series? State four components of time
series. Describe any one of them
4. What are the different models for time series? Describe them.
5. Discuss the simple average method for measuring seasonal variation.


Comments
Post a Comment