Posts

Introduction to Life Tables

Image
  Introduction to Life Tables  Definition :   A life table is a statistical tool used in demography and actuarial science to summarize mortality patterns in a population.   Purpose : i) Provides a snapshot of mortality conditions. ii) Helps in estimating survival probabilities for different age groups. iii) Essential for demographic studies, insurance, and public health planning.   Types of Life Tables    There are two common types of life table: 1. Complete or Simple and  2. Abridged life table. In complete life table age interval is a year where as in abridge life table age interval is more than one year i.e.  five or ten years (e.g., 0-1, 1-5, 5-10, etc.). A life table starts with convenient cohort (a group of persons all born at the same time) size like 100000 or 1000 known as radix.   (base population) .  The record of life table starts at the birth of each member and continues till all have d...

Ratio and Regression Method of Estimation

Image
  2.4 Ratio Method   Concept and rationale of Auxiliary Variable An auxiliary variable is an additional variable that is related to the main variable of interest in a statistical study but is not directly of interest itself. It is often used to improve the efficiency of an estimation process. The auxiliary variable is known or observed alongside the variable of interest and helps in reducing the variance of the estimates when used appropriately. The ratio method is most effective in situations where the auxiliary variable is easy to measure, and there is a strong linear relationship between the auxiliary and study variables. The method works best when the ratio of the two variables remains relatively stable across the population. Rationale for Using Auxiliary Variables Improving Precision : Auxiliary variables can significantly reduce the variance of the estimators, leading to more precise estimates. This is particularly useful when direct measurements of the main ...

Cluster Sampling, Idea of two stage sampling and Multi stage sampling

Image
  2.2 Cluster Sampling   It is one of the basic assumptions in any sampling procedure that the population can be divided into a finite number of distinct and identifiable units, called sampling units. The smallest units into which the population can be divided are called elements of the population. The groups of such elements are called clusters. In many practical situations and many types of populations, a list of elements is not available and so the use of an element as a sampling unit is not feasible. The method of cluster sampling or area sampling can be used in such situations.   In cluster sampling, -Divide the whole population into clusters according to some well-defined rule. -Treat the clusters as sampling units. -Choose a sample of clusters according to some procedure. -Carry out a complete enumeration of the selected clusters, i.e. collect information on all the      sampling units available in selected clusters.   Area...

Systematic Sampling

Image
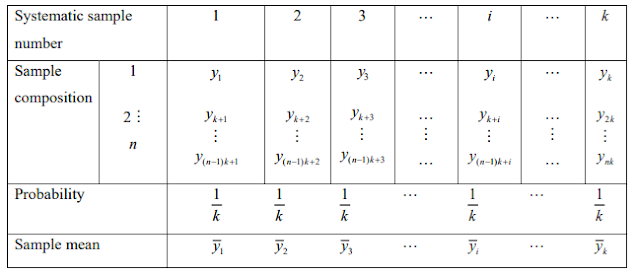
    Unit 2: Other sampling Methods   2.1 Systematic Sampling The systematic sampling technique is operationally more convenient than simple random sampling. It also ensures, at the same time that each unit has an equal probability of inclusion in the sample. In this method of sampling, the first unit is selected with the help of random numbers, and the remaining units are selected automatically according to a predetermined pattern. This method is known as systematic sampling. Suppose the N units in the population are numbered 1 to N in some order. Suppose further that N is expressible as a product of two integers n and k, so that N=nk.   To draw a sample of size n:   1. Select a random number between 1 and k. 2. Suppose it is i. 3. Select the first unit, whose serial number is i. 4. Select every k th unit after i th unit. The sample will contain I, i+k, i+2k,i+3k,.....,i+(n-1)k   serial number units. Thus, the first unit is selected at...